Statistics
Quiz Summary
0 of 52 Questions completed
Questions:
Information
You have already completed the quiz before. Hence you can not start it again.
Quiz is loading…
You must sign in or sign up to start the quiz.
You must first complete the following:
Results
Results
0 of 52 Questions answered correctly
Your time:
Time has elapsed
You have reached 0 of 0 point(s), (0)
Earned Point(s): 0 of 0, (0)
0 Essay(s) Pending (Possible Point(s): 0)
Categories
- Not categorized 0%
- 1
- 2
- 3
- 4
- 5
- 6
- 7
- 8
- 9
- 10
- 11
- 12
- 13
- 14
- 15
- 16
- 17
- 18
- 19
- 20
- 21
- 22
- 23
- 24
- 25
- 26
- 27
- 28
- 29
- 30
- 31
- 32
- 33
- 34
- 35
- 36
- 37
- 38
- 39
- 40
- 41
- 42
- 43
- 44
- 45
- 46
- 47
- 48
- 49
- 50
- 51
- 52
- Current
- Review / Skip
- Answered
- Correct
- Incorrect
-
Question 1 of 52
1. Question
\(\begin{aligned}
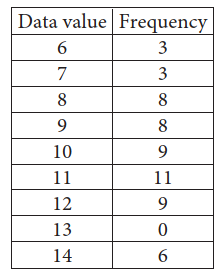
&\text{The frequency table summarizes the 57 data values in a data set. What is the maximum}\\
&\text{data value in the data set?}\end{aligned}\)CorrectIncorrect -
Question 2 of 52
2. Question
\(\begin{aligned}
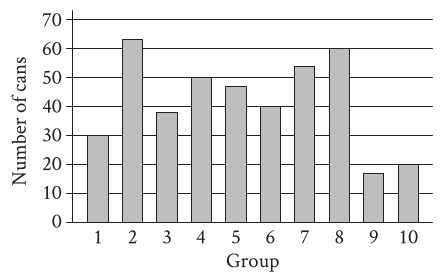
&\text{The bar graph shows the distribution of 419 cans collected by 10 different groups}\\
&\text{for a food drive. How many cans were collected by group 6?}\\
\end{aligned}\)CorrectIncorrect -
Question 3 of 52
3. Question
\(\begin{aligned}
&\text{The table summarizes the UV index value recorded by a research assistant at noon}\\
&\text{each day for 49 days.}\\&~~~~~~~~~~~~~~~~~~~~~~~~~~~~~~~~~~~~~~~~~~~~\begin{array}{|c|c|}\hline\text{ UV index}&\text{Number of days}\\\hline1&9\\\hline2&15\\\hline3&12\\\hline4&13\\\hline\end{array}\\\\
&\text{According to the table, a UV index value of 1 was recorded on how many days?}\end{aligned}\)CorrectIncorrect -
Question 4 of 52
4. Question
\(\begin{aligned}
&\text{The table shows the frequency of each value in a data set.}\\\\
&~~~~~~~~~~~~~~~~~~~~~~~~~~~~~~~~~~~~~~~~\begin{array}{|c|c|}\hline\text{Value}&\text{Frequency}\\\hline120&3\\\hline130&8\\\hline140&18\\\hline150&8\\\hline160&1\\\hline\end{array}\\\\&\text{What is the minimum value of the data set?}\end{aligned}\)CorrectIncorrect -
Question 5 of 52
5. Question
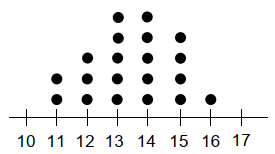
\(\begin{aligned}&\text{To study the characteristics of sea stars in a group of tide pools, researchers }\\
&\text{measured the diameter of the sea stars within the tide pools. The dot plot gives}\\&\text{the diameter, to the nearest inch, of each of the sea stars in these tide pools.}\end{aligned}\)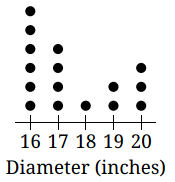
\(\begin{aligned}
&\text{Based on the dot plot, how many sea stars had a diameter, to the nearest inch,}\\
&\text{of 16 inches?}\end{aligned}\)CorrectIncorrect -
Question 6 of 52
6. Question
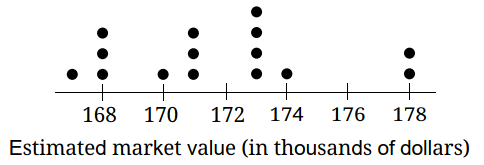
\(\begin{aligned}
&\text{The dot plot shows the estimated market values for 15 houses in a neighborhood. What is}\\
&\text{the maximum estimated market value, in thousands of dollars, for the data set?}\end{aligned}\)CorrectIncorrect -
Question 7 of 52
7. Question
\(\begin{aligned}
&\text{The dot plot shown gives the distribution of values in a data set. What is the minimum value}\\
&\text{in the data set ?}\end{aligned}\)CorrectIncorrect -
Question 8 of 52
8. Question
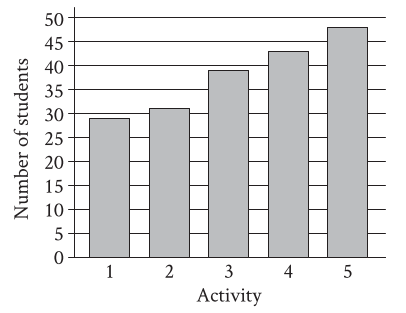
\(\begin{aligned}
&\text{A group of students voted on five after-school activities. The bar graph shows the number of}\\
&\text{students who voted for each of the five activities. How many students chose activity 3?}\end{aligned}\)CorrectIncorrect -
Question 9 of 52
9. Question
\(\begin{aligned}
&\text{The bar graph summarizes the charge, in kilowatt-hours (kWh), a battery }\\
&\text{received each day for 15 days.}\end{aligned}\)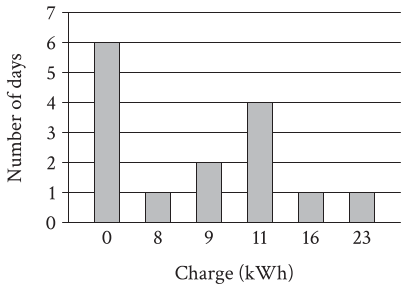
\(\text{For how many of these 15 days did the battery receive a charge of 0 kWh?}\)
CorrectIncorrect -
Question 10 of 52
10. Question
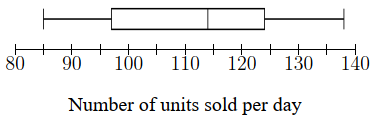
\(\begin{aligned}
&\text{A store owner recorded the number of units of a certain product that }\\
&\text{were sold per day for 28 days. What is the minimum number of units of}\\&\text{this product sold per day for these 28 days?}\end{aligned}\)CorrectIncorrect -
Question 11 of 52
11. Question
\(\begin{aligned}
&\text{The bar graph shows the number of trees planted for 4 separate plots of land on a tree}\\
&\text{farm.}\end{aligned}\)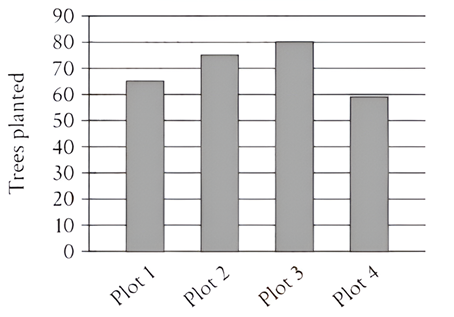
\(\text{What is the maximum number of trees planted on one of these 4 plots of land?}\)
CorrectIncorrect -
Question 12 of 52
12. Question
\(\text{The bar graph shows the frequency of each data value in a data set.}\)
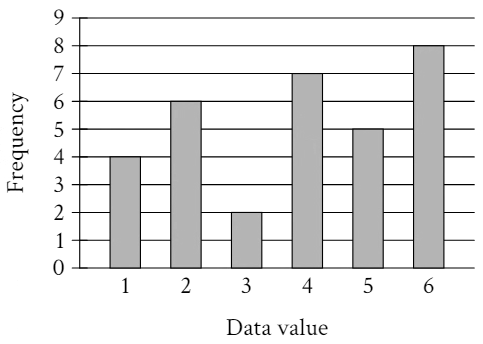
\(\text{What is the frequency of data value 2 in this data set?}\)
CorrectIncorrect -
Question 13 of 52
13. Question
\(\begin{aligned}
&\text{A list of 10 data values is shown.}\\\\
&~~~~~~~~~~~~~~~~~~~~~~~~~~~~~~~~~~~~~~~~~~~~~~6,8,16,4,17,26,8,5,5,5\\\\
&\text{What is the mean of these data?}\end{aligned}\)CorrectIncorrect -
Question 14 of 52
14. Question
\(\begin{aligned}
&\text{Each value in the data set shown represents the height, in centimeters, of a plant.}\\\\
&~~~~~~~~~~~~~~~~~~~~~~~~~~~~~~~~~~~~~~~~~~~~~~~~6,10,13,2,15,22,10,4,4,4\\\\
&\text{What is the mean height, in centimeters, of these plants?}\end{aligned}\)CorrectIncorrect -
Question 15 of 52
15. Question
\(
\begin{aligned}&\text{The list gives the mass, in grams, of 5 ruffed lemurs.}\\\\
&~~~~~~~~~~~~~~~~~~~~~~~~~~~~~~~~~~~~~\text{3,910; 3,910; 3,130; 3,950; 3,150}\\\\&\text{What is the mean mass, in grams, of these 5 ruffed lemurs?}\end{aligned}\)CorrectIncorrect -
Question 16 of 52
16. Question
\(\begin{aligned}&~~~~~~~~~~~~~~~~~~~~~~~~~~~~~~~~~~~~~~~~~~~~~~~~~~~~~~~~~~~~~~~\begin{array}{|c|c|}
\hline&\text{Time}\\
\text{Task}&\text{(minutes)}\\\hline
\text{A}&8\\\hline\text{B}&6\\\hline\text{C}&14\\\hline\text{D}&11\\\hline\text{E}&11\\\hline\end{array}\\\\&\text{The table shows the amount of time it took a participant in a study to complete each of 5}\\&\text{tasks. What was the mean time, in minutes, for this participant to complete a task?}\end{aligned}\)CorrectIncorrect -
Question 17 of 52
17. Question
\(\begin{aligned}&~~~~~~~~~~~~~~~~~~~~~~~~~~~~~~~~~~~~~~~~~~700,1200,1600,2000,x\\\\
&\text{If the mean of the five numbers above is 1600, what is the value of }x?\end{aligned}\)CorrectIncorrect -
Question 18 of 52
18. Question
\(\begin{aligned}
&\text{The mean score of 8 players in a basketball game was 14.5 points. If the highest}\\
&\text{individual score is removed, the mean score of the remaining 7 players becomes}\\&\text{12 points. What was the highest score?}\end{aligned}\)CorrectIncorrect -
Question 19 of 52
19. Question
\(\begin{aligned}
&\text{A survey of the daily commuting times, in minutes, of seven different Chicago-based}\\
&\text{employees at a certain company yielded a data set consisting of the values 32, 14, 44, 31, 51,}\\
&\text{24, and 44. A survey of the daily commuting times, in minutes, of seven different San}\\
&\text{Francisco-based employees at the same company yielded a data set consisting of the values}\\
&46,32,19,34,48,x,\text{and }38.\text{ If the means of the two data sets are equal, what is the value of }\\&x?\end{aligned}\)CorrectIncorrect -
Question 20 of 52
20. Question
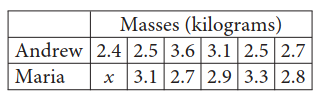
\(\begin{aligned}
&\text{Andrew and Maria each collected six rocks, and the masses of the rocks are shown in the table }\\
&\text{above. The mean of the masses of the rocks Maria collected is 0.1 kilogram greater than the }\\
&\text{mean of the masses of the rocks Andrew collected. What is the value of }x?\end{aligned}\)CorrectIncorrect -
Question 21 of 52
21. Question
\(\begin{aligned}
&\text{Data set A consists of the heights of 75 buildings and has a mean of 32 meters. Data set B }\\
&\text{consists of the heights of 50 buildings and has a mean of 62 meters. Data set C consists of}\\
&\text{the heights of the 125 buildings from data sets A and B. What is the mean, in meters, of}\\&\text{data set C?}\end{aligned}\)CorrectIncorrect -
Question 22 of 52
22. Question
\(\begin{aligned}&\text{An environmental scientist is investigating the volatility of 175 organic compounds by}\\&\text{finding the boiling point of each compound. The mean boiling point of all 175}\\&\text{compounds is 167 degrees Celsius. The scientist classifies each of these compounds as}\\&\text{either semivolatile or volatile. Of the 175 compounds, 50 compounds were classified as}\\&\text{semivolatile, and these 50 compounds have a mean boiling point of 327 degrees}\\&\text{Celsius. The remaining 125 compounds were classified as volatile. What is the mean}\\&\text{boiling point, in degrees Celsius, of the 125 compounds classified as volatile}\\&\text{compounds?}\end{aligned}\)
CorrectIncorrect -
Question 23 of 52
23. Question
\(\begin{aligned}
&~~~~~~~~~~~~~~~~~~~~~~~~~~~~~~~~~~~~~~~~~~~~~~~~~~~~~~~~~~~~~~~~~~~\text{Data set X: 5, 9, 9, 13}\\&~~~~~~~~~~~~~~~~~~~~~~~~~~~~~~~~~~~~~~~~~~~~~~~~~~~~~~~~~~~~~~~~~~~\text{Data set Y: 5, 9, 9, 13, 27}\\\\
&\text{The lists give the values in data sets X and Y. Which statement correctly compares }\\
&\text{the mean of data set X and the mean of data set Y?}
\end{aligned}\)CorrectIncorrect -
Question 24 of 52
24. Question
\(\begin{aligned}
&~~~~~~~~~~~~~~~~~~~~~~~~~~~~~~~~~~~~~~~~~~~~~~~~~~~\begin{array}{|c|c|c|}\hline\text{}&\text{Data set A}&\text{Data set B}\\\text{Value}&\text{frequency}&\text{frequency}\\
\hline40&2&8\\\hline43&4&7\\\hline46&5&5\\\hline49&7&4\\\hline52&8&2\\\hline\end{array}\\\\
&\text{Data set A and data set B each consist of 26 values. The table shows the frequencies of the}\\&\text{values for each data set. Which of the following statements best compares the means of}\\&\text{the two data sets?}\end{aligned}\)CorrectIncorrect -
Question 25 of 52
25. Question
\(\begin{aligned}&~~~~~~~~~~~~~~~~~~~~~~~\begin{array}{|c|c|c|c|c|}\hline\text{}&\text{Data set A}&\text{Data set B}&\text{Data set C}&\text{Data set D}\\\text{Values}&\text{frequency}&\text{frequency}&\text{frequency}&\text{frequency}\\\hline40&0&0&8&8\\\hline43&2&3&3&4\\\hline46&4&3&3&2\\\hline49&8&8&0&0\\\hline\end{array}\\\\
&\text{The table shows the frequencies of the data values for four data sets. Which data set has the}\\
&\text{greatest mean?}\end{aligned}\)CorrectIncorrect -
Question 26 of 52
26. Question
\(\begin{aligned}&\text{Each of the following frequency tables represents a data set. Which data set has the}\\&\text{greatest mean?}\end{aligned}\)
CorrectIncorrect -
Question 27 of 52
27. Question
\(\begin{aligned}&\text{Five }Eretmochelys~imbricata,\text{ a type of sea turtle, each have a nest. The table }\\
&\text{shows an original data set of the number of eggs that each turtle laid in its nest.}\\\\
&~~~~~~~~~~~~~~~~~~~~~~~~~~~~~~~~~~~~~~~~~~~~~~~~~\begin{array}{|c|c|}\hline\text{Nest}&\text{Number of eggs}\\\hline\mathrm{A}&149\\\hline\mathrm{B}&144\\\hline\mathrm{C}&148\\\hline\mathrm{D}&136\\\hline\mathrm{E}&139\\\hline\end{array}\\\\
&\text{A sixth nest with 121 eggs is added to create a new data set. Which of the}\\&\text{following correctly compares the means of the two data sets?}
\end{aligned}\)CorrectIncorrect -
Question 28 of 52
28. Question
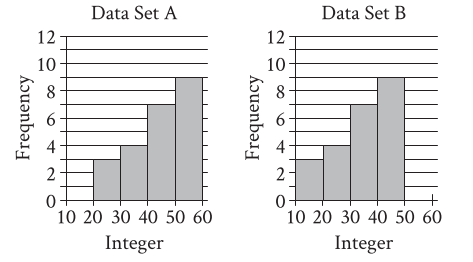
\(\begin{aligned}
&\text{Two data sets of 23 integers each are summarized in the histograms shown. For each of }\\
&\text{the histograms, the first interval represents the frequency of integers greater than or}\\
&\text{equal to 10, but less than 20. The second interval represents the frequency of integers}\\
&\text{greater than or equal to 20, but less than 30, and so on. What is the smallest possible} \\
&\text{difference between the mean of data set A and the mean of data set B?}\end{aligned}\)CorrectIncorrect -
Question 29 of 52
29. Question
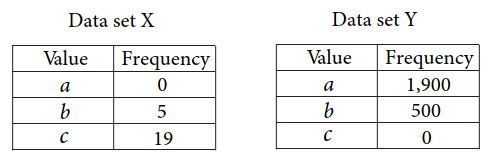
\(\begin{aligned}&\text{Data sets X and Y are summarized in the tables shown, where }a,b,\text{ and }c\text{ are positive,}\\&\text{consecutive integers and }a < b < c.\text{ Which statement comparing the means of the data sets}\\&\text{is true?}\end{aligned}\)
CorrectIncorrect -
Question 30 of 52
30. Question
\(\begin{aligned}&~~~~~~~~~~~~~~~~~~~~~~~~~~~~~~~~~73,74,75,77,79,82,84,85,91\\\\&\text{What is the median of the data shown?}\end{aligned}\)
CorrectIncorrect -
Question 31 of 52
31. Question
\(\begin{aligned}&~~~~~~~~~~~~~~~~~~~~~~~~~~~~~~~~~~~~~~~~~~~~~~~~~~~~~~~~13,17,23,6,4,8,17,15,16\\\\
&\text{The list gives the low temperatures, in degrees Fahrenheit, for 9 days in December in a}\\
&\text{certain city. According to the list, what is the median low temperature, in degrees}\\
&\text{Fahrenheit, for these 9 days?}\end{aligned}\)CorrectIncorrect -
Question 32 of 52
32. Question
\(\begin{aligned}
&~~~~~~~~~~~~~~~~~~~~~~~~~~~~~~~~~~~~~~~~~~~~~~~~\text{Data set A: 2, 2, 2, 5, 5, 8, 11, 11, 14, 14, 14}\\
&~~~~~~~~~~~~~~~~~~~~~~~~~~~~~~~~~~~~~~~~~~~~~~~~~\text{Data set B: 2, 5, 5, 8, 8, 8, 8,11, 11, 11, 14}\\\\
&\text{Data set A and data set B each have 11 values. Which of the following statements best}\\
&\text{compares the median of data set A and the median of data set B?}\end{aligned}\)CorrectIncorrect -
Question 33 of 52
33. Question
\(\begin{aligned}&~~~~~~~~~~~~~~~~~~~~~~~~~~~~~~~~~~~~~~~~~~~~~~~~~~~~~~~~~~\begin{array}{|c|c|}\hline\text{Number of}&\text{Number of}\\\text{queen ants}&\text{colonies}\\\hline1&11\\\hline2&9\\\hline3&7\\\hline4&6\\\hline5&6\\\hline\end{array}\\\\
&\text{Scientists collected acorns that each housed a colony of a particular species and then analyzed}\\
&\text{each colony’s structure. For these colonies, the table summarizes the number of queen ants}\\
&\text{per colony. For these colonies, what is the median number of queen ants per colony?}\\
\end{aligned}\)CorrectIncorrect -
Question 34 of 52
34. Question
\(\begin{aligned}&~~~~~~~~~~~~~~~~~~~~~~~~~~~~~~~~~~~~~~~~~~~~~\begin{array}{|c|c|}\hline\text{Number of birds}&\text{Number of days}\\\hline14&3\\\hline15&3\\\hline16&4\\\hline17&1\\\hline18&3\\\hline19&9\\\hline\end{array}\\\\
&\text{A science class studied the feeding behavior of the birds that visited a bird feeder each}\\
&\text{school day for a period of time. The table summarizes the number of birds the class}\\&\text{observed visiting the bird feeder each school day during this period of time. What is the}\\&\text{median number of birds the class observed visiting the bird feeder each school day during}\\&\text{this period of time?}\end{aligned}\)CorrectIncorrect -
Question 35 of 52
35. Question
\(\begin{aligned}
&\text{The table shown summarizes the number of employees at each of the 17 restaurants }\\&\text{in a town.}\end{aligned}\)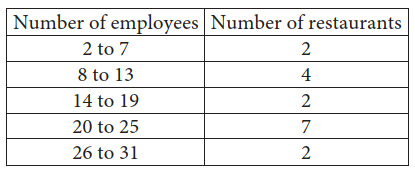
\(\begin{aligned}&\text{Which of the following could be the median number of employees for}\\&\text{the restaurants in this town?}\end{aligned}\)
CorrectIncorrect -
Question 36 of 52
36. Question
\(\begin{aligned}
&\text{The table shows the distribution of height, in centimeters, of 25 objects.}\\\\
&~~~~~~~~~~~~~~~~~~~~~~~~~~~~~~~~~~~~~~~~~~~~~~~~~~~~~~\begin{array}{|c|c|}\hline\text{Height}&\text{Frequency}\\\hline\text{0 to 100}&8\\\hline\text{101 to 200}&6\\\hline\text{201 to 300}&5\\\hline\text{301 to 400}&4\\\hline\text{401 to 500}&2\\\hline\end{array}\\\\&\text{Which of the following could be the median height of these objects?}\end{aligned}\)CorrectIncorrect -
Question 37 of 52
37. Question
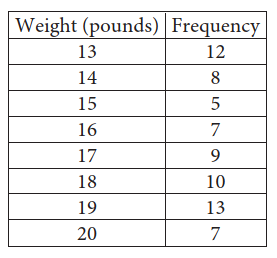
\(\begin{aligned}&\text{The frequency table summarizes a data set of the weights, rounded to the nearest pound, of}\\&\text{71 tortoises. A weight of 39 pounds is added to the original data set, creating a new data set}\\&\text{of the weights, rounded to the nearest pound, of 72 tortoises. Which statement best compares}\\&\text{the mean and median of the new data set to the mean and median of the original data set?}\end{aligned}\)
CorrectIncorrect -
Question 38 of 52
38. Question
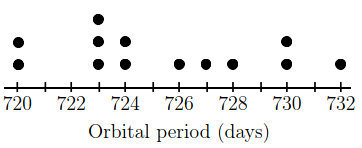
\(\begin{aligned}
&\text{A data set of the orbital periods, rounded to the nearest whole number of Earth days for}\\
&\text{13 of Jupiter’s moons is represented in the dot plot. An additional moon with an orbital}\\
&\text{period of 628 days is added to the original data set to create a new data set of 14 orbital}\\
&\text{periods. Which statement best compares the mean and median of the new data set to the}\\
&\text{mean and median of the original data set?}\end{aligned}\)CorrectIncorrect -
Question 39 of 52
39. Question
\(\begin{aligned}&\text{Data set F consists of 55 integers, where the value of each integer is between 150 and 260.}\\&\text{Data set G consists of the same 55 integers in data set F as well as the integer 10. Which of}\\&\text{the following must be less for data set G than for data set F?}\\\\&~~~~~~~\text{ I. The mean}\\&~~~~~~\text{ II. The median}\end{aligned}\)
CorrectIncorrect -
Question 40 of 52
40. Question
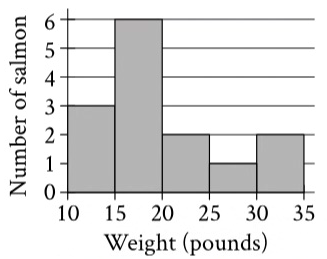
\(\begin{aligned}&\text{The histogram summarizes a data set of the weights, in pounds, of 14 salmon. If an}\\&\text{additional weight of 85 pounds is added to the original data set to create a new data set of 15}\\&\text{weights of salmon, which of the following measures must be greater for the new data set}\\&\text{than for the original data set?}\\\\
&~~~~~~\text{ I. The median}\\
&~~~~~\text{ II. The mean}\end{aligned}\)CorrectIncorrect -
Question 41 of 52
41. Question
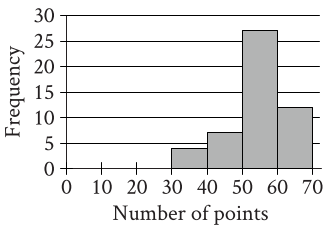
\(\begin{aligned}&\text{The histogram summarizes data set A, which represents the number of points per player }\\
&\text{earned by 50 players of a game. A new player earns 18 points playing the game,}\\&\text{and this number of points is added to data set A to create data set B with 51 values.}\\&\text{Which of the following must be true?}\\\\
&~~~~~~~~~\text{I. }\text{The median number of points per player for data set B is less than}\\
&~~~~~~~~~~~~\text{ the median number of points per player for data set A.}\\\\&~~~~~~~~\text{II. }\text{The mean number of points per player for data set B is less than}\\&~~~~~~~~~~~~\text{ the mean number of points per player for data set A.}\end{aligned}\)CorrectIncorrect -
Question 42 of 52
42. Question
\(\begin{aligned}&~~~~~~~~~~~~~~~~~~~~~~~~~~~~~~~~~~~~~~~~23,27,27,32,35,36,52\\\\&\text{What is the range of the 7 scores shown?}\end{aligned}\)
CorrectIncorrect -
Question 43 of 52
43. Question
\(\begin{aligned}
&\text{The list gives the number of individuals in each of 6 groups of ring-tailed lemurs.}\\\\
&~~~~~~~~~~~~~~~~~~~~~~~~~~~~~~~~~~~~~~~~~~~~~~~~~~~~17,4,20,17,18,6\\\\
&\text{What is the range of the numbers of individuals for the 6 groups of ring-tailed }\\&\text{lemurs?}\end{aligned}\)CorrectIncorrect -
Question 44 of 52
44. Question
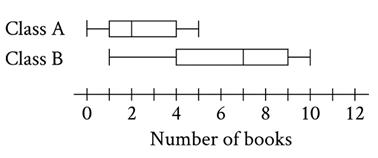
\(\begin{aligned}&\text{The two box plots show the distribution of number of books read}\\&\text{over the summer by the students in two different English classes.}\\&\text{What is the positive difference between the ranges of number of}\\&\text{books read over the summer for the two classes?}\end{aligned}\)
CorrectIncorrect -
Question 45 of 52
45. Question
\(\begin{aligned}
&\text{The dot plot represents the 15 values in data set A. Data set B is created by adding 56 }\\
&\text{to each of the values in data set A. Which of the following correctly compares the }\\
&\text{medians and the ranges of data sets A and B?}\end{aligned}\)CorrectIncorrect -
Question 46 of 52
46. Question
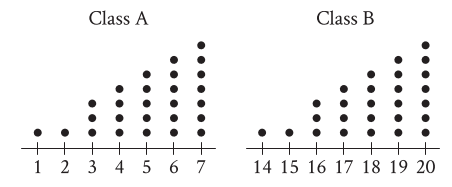
\(\begin{aligned}
&\text{Each of the dot plots shown represents the number of glue sticks brought in by each student }\\
&\text{for two classes, class A and class B. Which statement best compares the standard deviations }\\
&\text{of the numbers of glue sticks brought in by each student for these two classes?}\end{aligned}\)CorrectIncorrect -
Question 47 of 52
47. Question
\(\text{The values in data sets X and Y are shown in the table.}\)
\(\begin{array}{|c|c|c|c|c|c|c|c|c|c|}\hline\mathrm{Data}\\\text{set X}&13&13&14&14&15&16&16&17&17\\\hline\text{Data}\\\text{set Y}&2&2&3&3&4&5&5&6&6\\\hline\end{array}\)
\(\begin{aligned}&\text{The standard deviation of data set X is }q,\text{and the standard deviation of data set Y is }s.\text{ Which}\\&\text{of the following statements about the standard deviation of the data sets is true?}\end{aligned}\)
CorrectIncorrect -
Question 48 of 52
48. Question
\(\begin{aligned}&\text{Each of the following frequency tables represents a data set. Which of these frequency tables}\\&\text{represents the data set with the smallest standard deviation?}\end{aligned}\)
CorrectIncorrect -
Question 49 of 52
49. Question
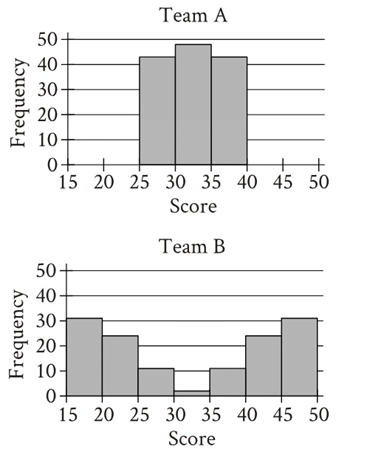
\(\begin{aligned}&\text{The histograms summarize the distributions of scores for team A and team B. Which}\\&\text{statement best compares the standard deviations of scores for these teams?}\end{aligned}\)
CorrectIncorrect -
Question 50 of 52
50. Question
\(\begin{aligned}&~~~~~~~~~~~~~~~~~~~~~~~~~~~~~~~~~~~~~~~~~~~~~~~~~~~\text{Data set A: 8, 11, 12, 15, 21, 27}\\&~~~~~~~~~~~~~~~~~~~~~~~~~~~~~~~~~~~~~~~~~~~~~~~~~~~\text{ Data set B: 9, 12, 13, 16, 22, }h\\\\&\text{Data sets A and B each consist of 6 values as shown, where }h\text{ is a constant. If the standard}\\&\text{deviation of data set A is greater than the standard deviation of data set B, which of the}\\&\text{following could be the value of }h?\\&~~~~~~\text{I. 23}\\&~~~~\text{II. 28}\\&~~~\text{III. 29}\end{aligned}\)
CorrectIncorrect -
Question 51 of 52
51. Question
\(\text{The dot plots represent the distributions of values in data sets A and B.}\)
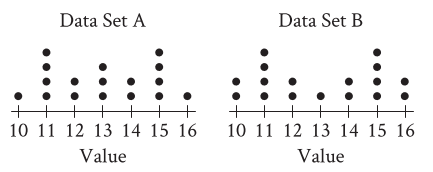
\(\begin{aligned}&\text{Which of the following statements must be true?}\\\\
&~~~~~~~~~\text{I. The median of data set A is equal to the median of data set B.}\\
&~~~~~~~~\text{II. The standard deviation of data set A is equal to the standard }\\&~~~~~~~~~~~~~\text{deviation of data set B.}\end{aligned}\)CorrectIncorrect -
Question 52 of 52
52. Question
\(\begin{aligned}
&\text{Ari examined a set of 86 plants. The lightest plant has a mass of 2.8 kilograms (kg) and}\\
&\text{the heaviest plant has a mass of 6.2 kg. Chihiro examined the same set of 86 plants and}\\
&\text{also an additional plant with a mass of 11.7 kg. Which of the following must be true about}\\
&\text{the set of plants that Ari examined and the set of plants that Chihiro examined?}\end{aligned}\)CorrectIncorrect